CLINICAL TRIALS · MISSING DATA · 15 SEPTEMBER 2026
What if the missing outcomes were different?
Tipping-point analysis makes an unverifiable assumption visible: how far would outcomes among missing participants have to differ before the interpretation changes?
Keep the observed data fixed
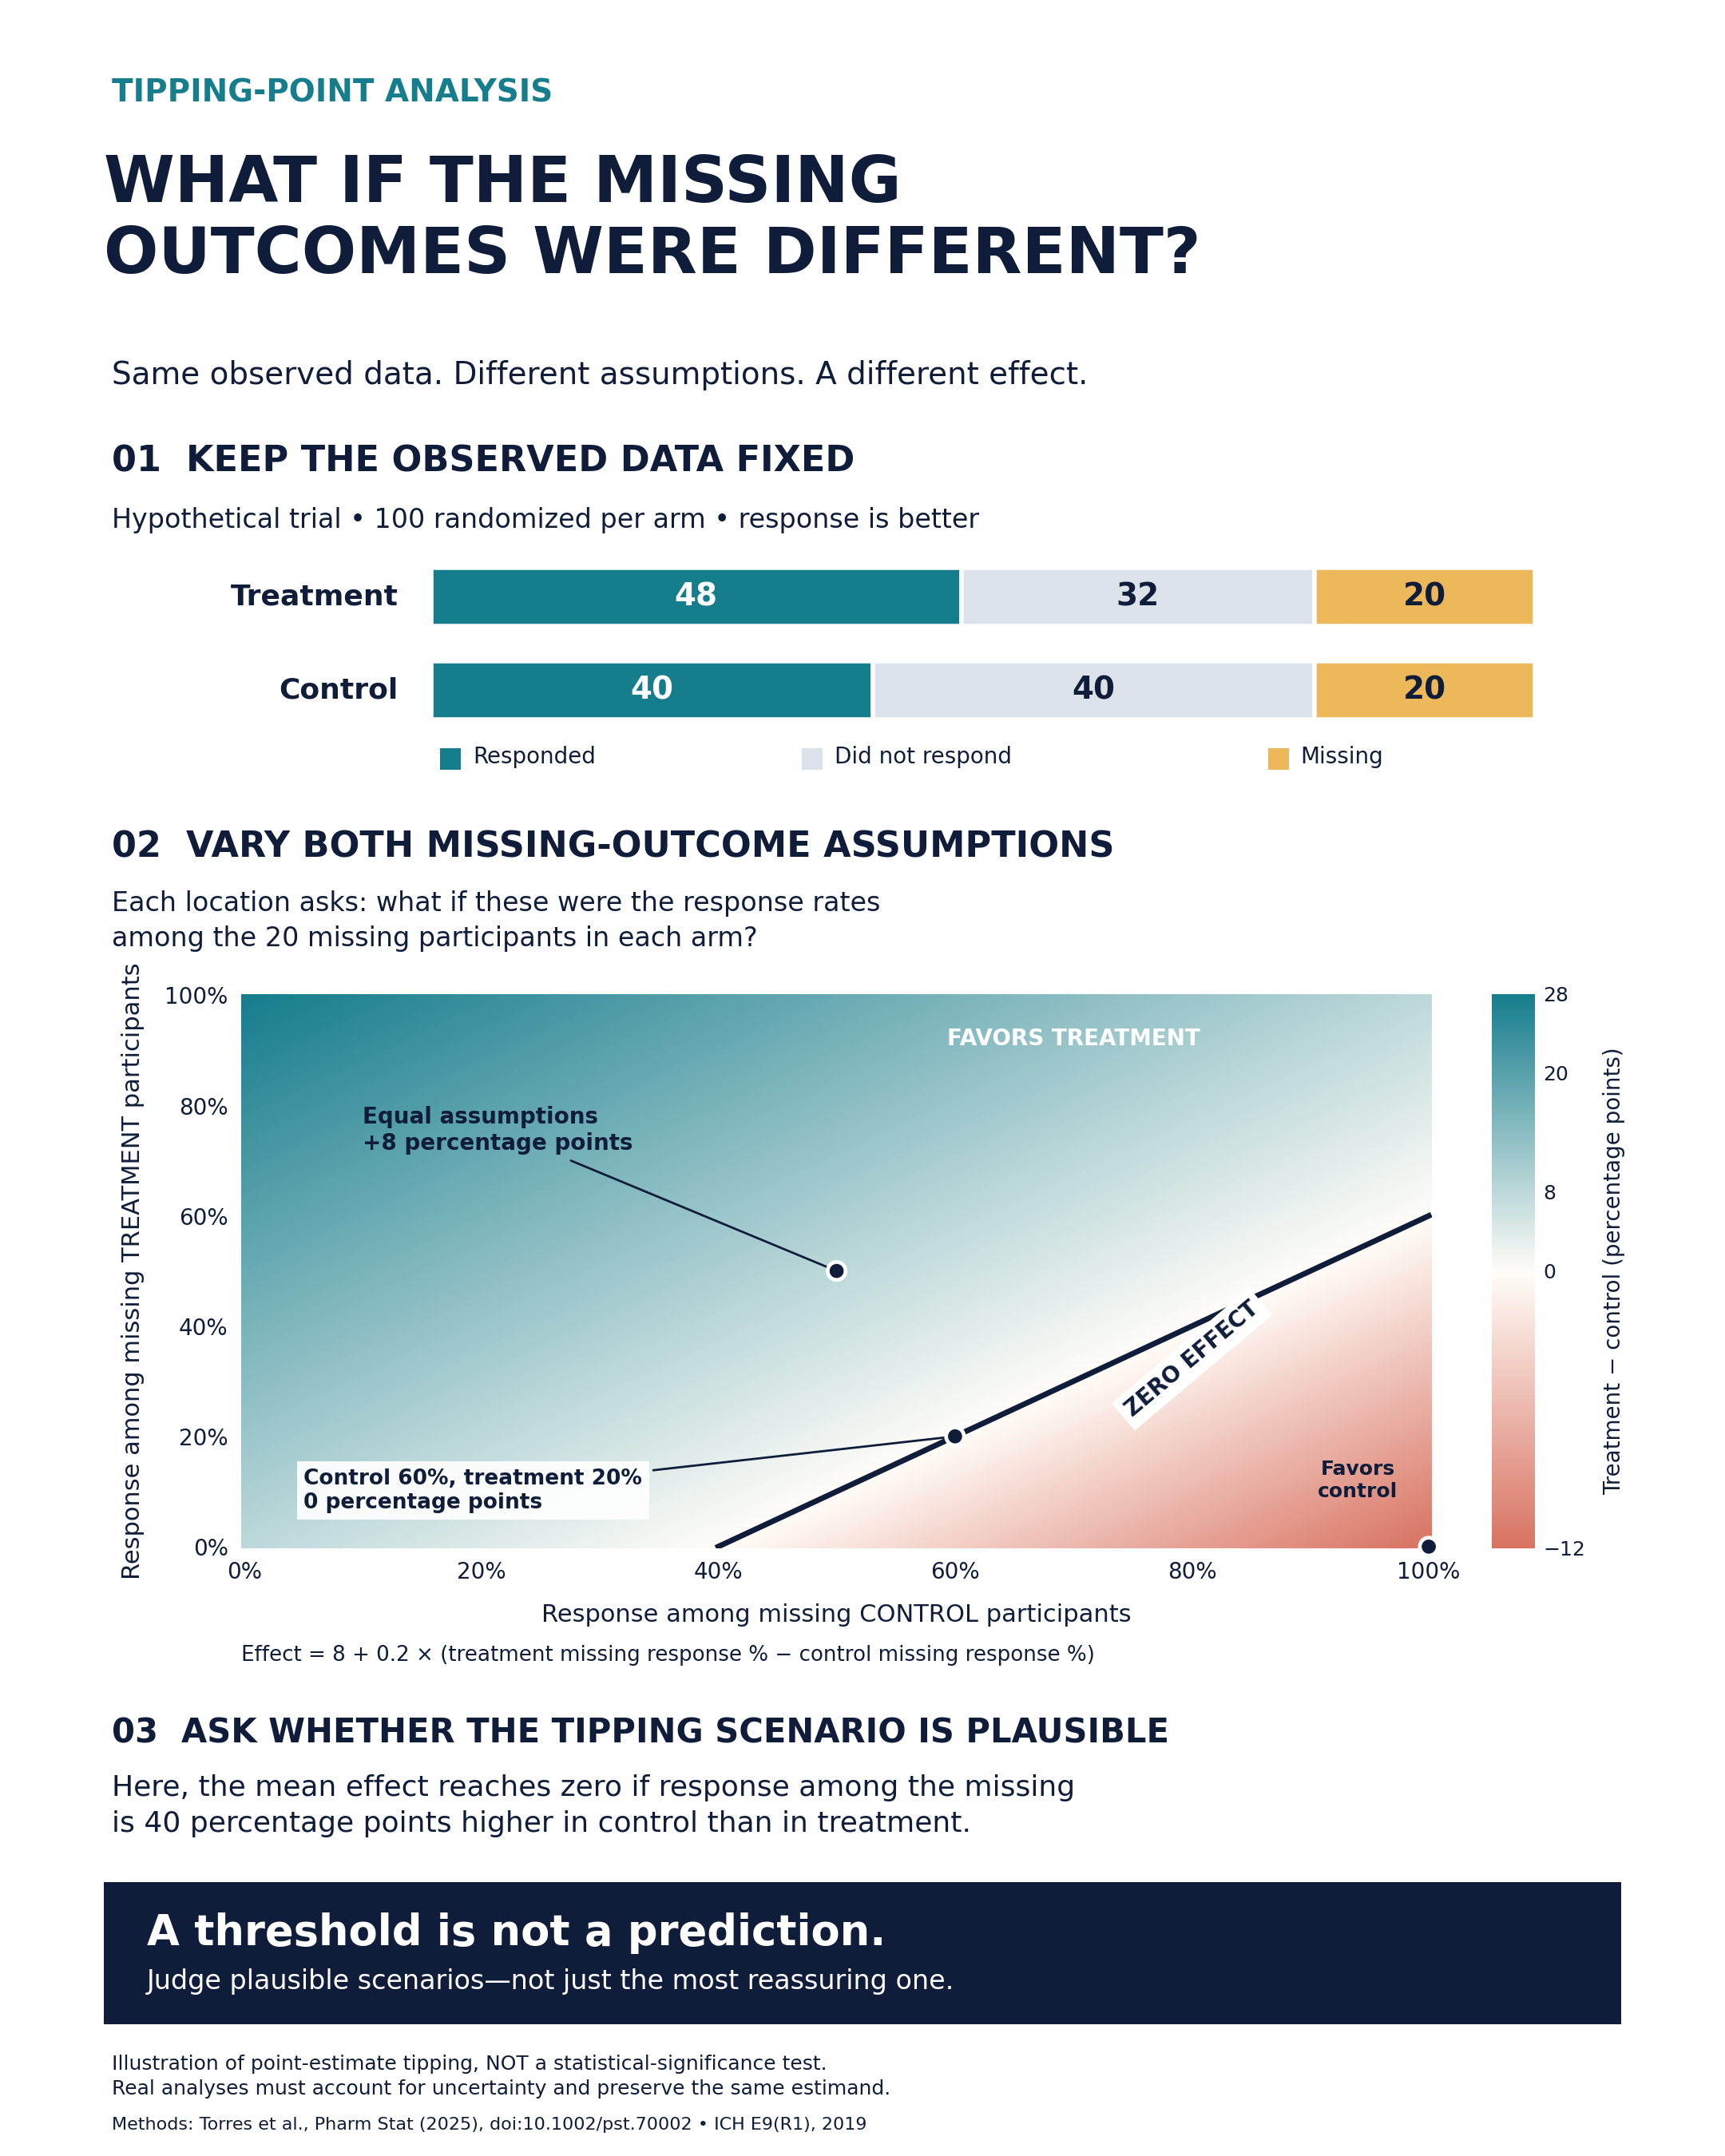
Consider a binary response at a prespecified follow-up in all 100 randomized participants per arm. A response is favorable. Treatment has 48 observed responses and 32 observed nonresponses; control has 40 of each. Both arms have 20 missing responses. Assume the endpoint remains well-defined for everyone; an outcome undefined after death would require a different estimand strategy.
The complete-case response rates are 48/80 = 60% and 40/80 = 50%, a 10-percentage-point difference. That is not automatically the treatment effect in all randomized participants.
Vary assumptions in both arms
Let rT and rC denote assumed response percentages among missing treatment and control participants, respectively. Keep the observed responses unchanged and retain all 100 participants in each denominator.
Control response % = 40 + 0.2 × rC
Risk difference (percentage points) = 8 + 0.2 × (rT − rC)
The heatmap varies these percentages continuously as a sensitivity model for expected missing responses. Exact completed samples of 20 have response percentages in 5-point increments; all scenarios below are achievable exact counts.
| Response among missing: treatment / control | Full-arm response: treatment / control | Difference |
|---|---|---|
| 50% / 50% | 58% / 50% | +8 pp |
| 20% / 60% | 52% / 52% | 0 pp |
| 0% / 100% | 48% / 60% | −12 pp |
Equal response assumptions among the missing yield a full-arm difference of +8 percentage points. They are not the same as assuming that missing participants in each arm have that arm’s observed response rate. The latter assumption—60% in treatment and 50% in control—would yield +10 percentage points.
Read the boundary, then judge plausibility
The point estimate reaches zero when rC − rT = 40 percentage points. Below that difference, the point estimate favors treatment; above it, the point estimate favors control. Equal missingness percentages do not guarantee robustness: the outcomes among missing participants may still differ.
The boundary is an algebraic threshold, not an estimate of what actually happened. Judge the scenarios using reasons for missingness, earlier outcomes, follow-up after treatment discontinuation, external evidence, and clinical knowledge. Prespecify clinically defensible scenarios where possible; do not select bounds because they preserve a preferred conclusion.
The useful question is whether a plausible missing-outcome scenario would change the inference.
What this visual does—and does not—show
- This illustration targets the full-arm response risk difference and identifies where its point estimate changes sign. It does not calculate standard errors, confidence intervals, p-values, or a clinical-importance threshold.
- A statistical-significance tipping boundary can occur before the estimated effect reaches zero. An actual inferential analysis must propagate uncertainty appropriately rather than treating assumed or imputed outcomes as known observed data.
- Main and sensitivity analyses should target the same estimand. Missing data are not interchangeable with treatment discontinuation, rescue treatment, or other intercurrent events.
- The plot illustrates a general principle supported by Torres and colleagues; it does not reproduce their specific inferential procedure. Their method uses arm-specific dropout-versus-completer mean differences and an inferential statistic.
- No tipping within an explored region supports robustness only within that region and the chosen analysis—not proof that the missing-data assumption is true.
Primary sources
- Torres C, Levin G, Rubin D, et al. A Tipping Point Method to Evaluate Sensitivity to Potential Violations in Missing Data Assumptions. Pharmaceutical Statistics. 2025;24(3):e70002. doi:10.1002/pst.70002. Peer-reviewed methods paper supporting systematic two-arm sensitivity exploration.
- ICH E9(R1): Addendum on Estimands and Sensitivity Analysis in Clinical Trials. Final Step 4 guideline, 20 November 2019; section A.5.2. Regulatory framework for estimand-aligned sensitivity analyses.
The numbers, graph, and worked example are original educational constructions. No patient data are used.